De-Mystifying Google Analytics Part 1: Internal Site Search

Most websites utilize some form of internal search that allows users to quickly find what they’re looking for by typing keywords into the search box. But many website owners and marketers don’t realize that this internal search data is available to them through search content reporting in Google Analytics – and that it can go a long way in helping them better serve their users.
Internal site search is a direct line of communication from your site users to you. It allows you to see exactly which keywords users are entering when looking for information on your site. It tells you what pages the search led them to, what pages they clicked, how many users went back to “refine their search,” and how many users directly exited the site after completing a search.
How can this data help you improve your site?
First of all, use the data to help you better optimize your site’s architecture to ensure visitors are finding the information they seek. Analyze the “Search Terms” in Google Analytics for any trends that reveal which areas of the site are performing well – and which are performing not-so-well. Areas that aren’t performing well probably need to be reorganized or relabeled or both.
Then use the data to help you update your content – including page metadata. Are you seeing acronyms or other brand-specific terms in your search content reports in Google Analytics? That means people are searching for those terms, and if you haven’t included those terms in the metadata of relevant pages, your users are getting a “no results” message in their search results. But by adding those terms to the metadata, you can ensure that users who search for them will get a search results page listing all the relevant content pages.
You can also take this analysis one step further by applying the “Refined Keyword” dimension in Google Analytics. This allows you to see what keywords the users searched for after their initial search, if those initial results did not satisfy their query. Here’s how to get the data:
- Within the behavior section of Google Analytics reporting, select “Search Terms” under the Site Search heading. You’ll see the list of keywords that users have searched for within your website.
- Next, apply the secondary dimension of “Refined Keyword.” Here’s an example of what it looks like:
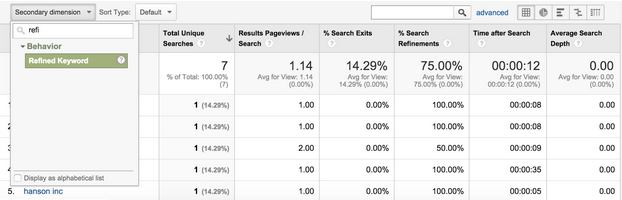
.webp)
Once you’ve drilled into this, you’ll have a more in-depth view of your users’ expectations. The way they refine their search will help you understand what topics or phrases they see as connected. And the steps they take after their search (navigating to another section, exiting the site, etc.) will provide insight into how frustrated they were by their search and what other information they might be interested in.
Spending some time with the “Search Terms” and “Refined Keyword” dimension in your Google Analytics report can help you better understand your audiences, improve your site navigation, and create better content. All of which leads to a better – and probably more profitable – user experience.